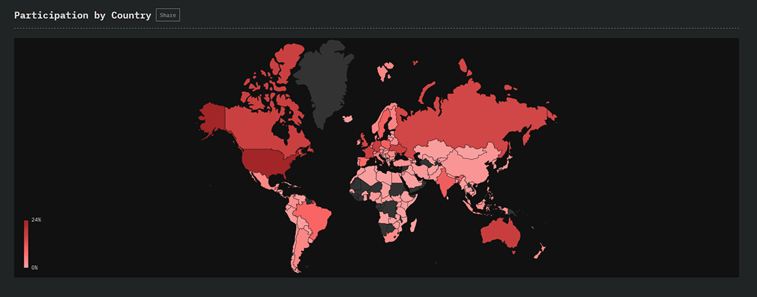
More than 20,000 developers from 153 countries around the world participated in a survey about JavaScript libraries, frameworks, text editors, and flavors they use and love. Their answers were gathered together to create The State of JavaScript in 2018 as an invaluable collection of stats and insights about JS technologies.
Thousands of participants expressed their happiness about some of the technologies and their interest in learning new ones, as well as the lack of inspiration for trying out some others. Well, yes, there is a tremendous amount of JavaScript technologies that might be helpful to front-end and back-end developers out there, but not everyone can be familiar with everything.
JavaScript Trends
Are you curious to know the winners of the State of JS awards, issued for the first time this year? Want to find out which technologies are the most satisfying, most mentioned, most used in the JavaScript ecosystem?
Well, here is a bit of a disclosure – Jest seems to be the library with the highest percentage of satisfied users, while GraphQL happens to be the technology that developers are most interested in learning.
There are some more novelties in the 2018 survey as well. Those include dark website mode, historical data for a comparison of results to previous years where possible, and giving each library an individual page for more detailed insights.
The team of the 2018 survey involves:
- Sacha Greif – for design, writing, and coding
- Raphaël Benitte – for data analysis and visualizations
- Michael Rambeau – for writing and additional stats
Sacha Greif actually started The State of JS survey back in 2016. He is also known as the creator of Sidebar and the React+GraphQL JavaScript framework Vulcan.js, while Raphaël Benitte is the maker of the React data visualization library Nivo.js, and Michael Rambeau is well-known for his JavaScript library directory Best of JS.
Do you want to take a peek into the behind-the-scenes making-of process for this survey? Sacha Greif has revealed some of the steps.
“We collected the data using Typeform, and we built our own command-line tool to generate surveys from YAML outlines through their API, which was a huge help for iterating quickly. We then treated and normalized the data using Elasticsearch, and we plugged the resulting JSON files into Gatsby to generate the site. We used a combination of Gatsby’s GraphQL data-querying features and plain old imports to load the data”, explained Sacha Greif in his recent article for the freeCodeCamp.
If you are eager to find out more, the whole project is available on GitHub for learning purposes.
And one more thing. We must say that the State of JS website is a piece of art for itself, along with that dark mode, innovative data visualizations, and a smart use of colors. Kudos to its creators for making such a remarkable digital experience!
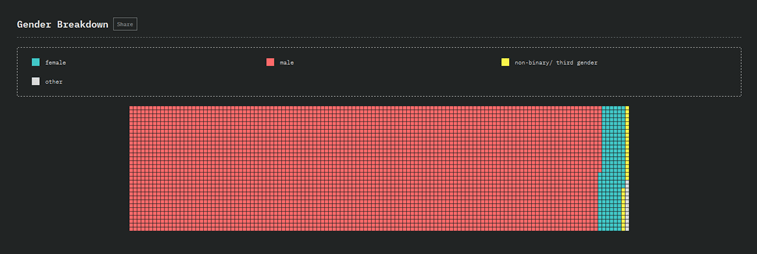
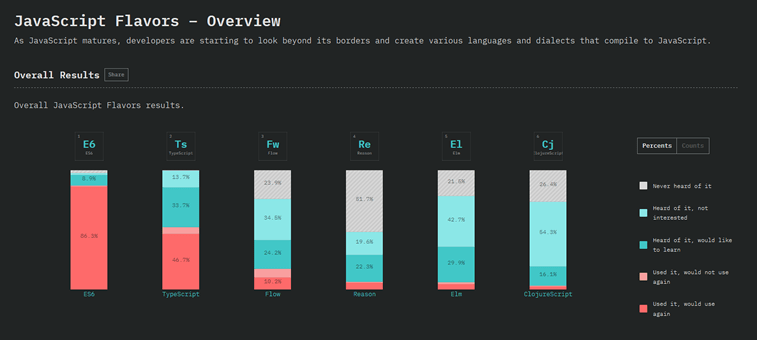
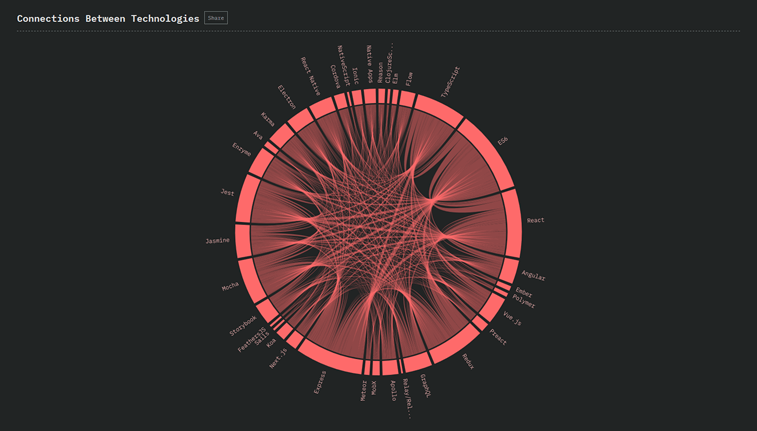
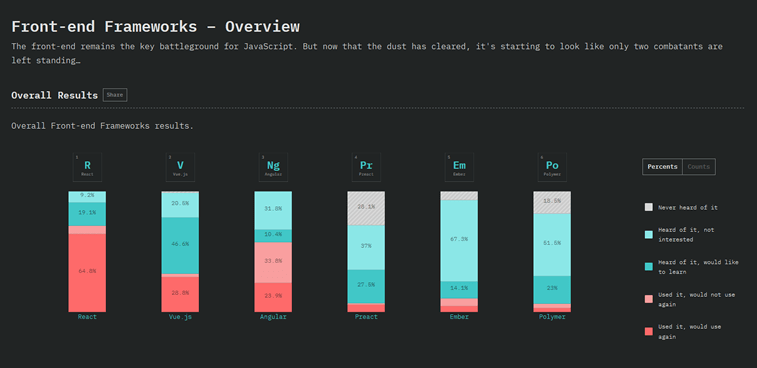
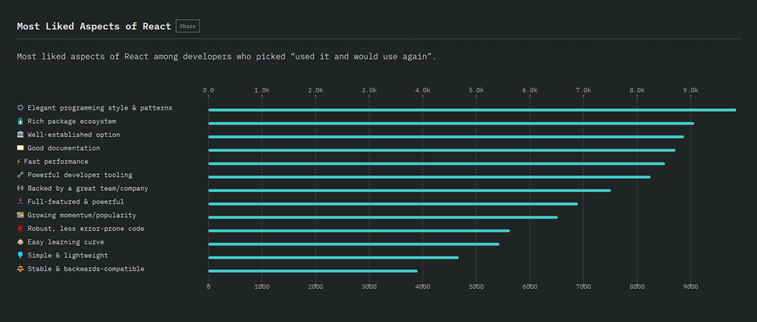
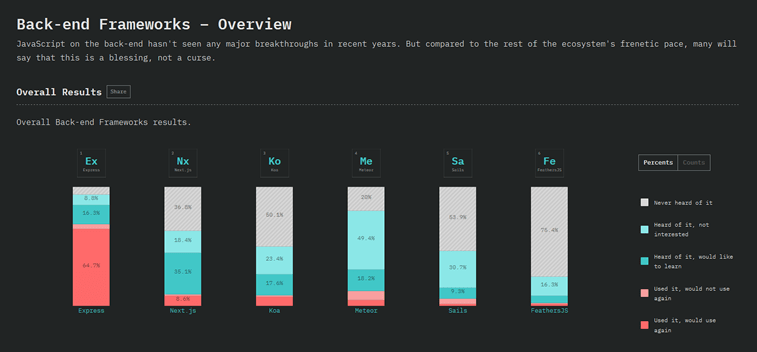
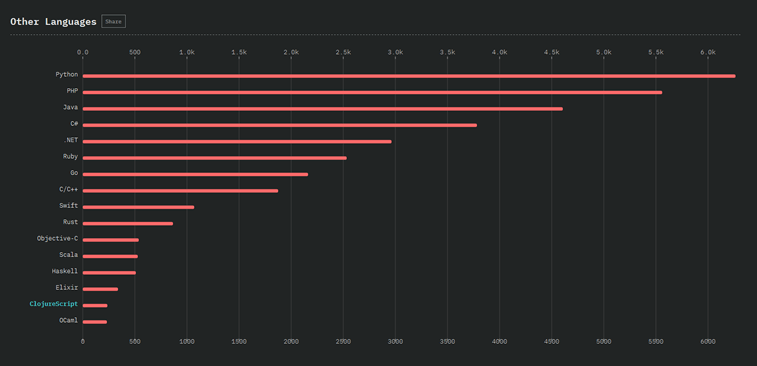
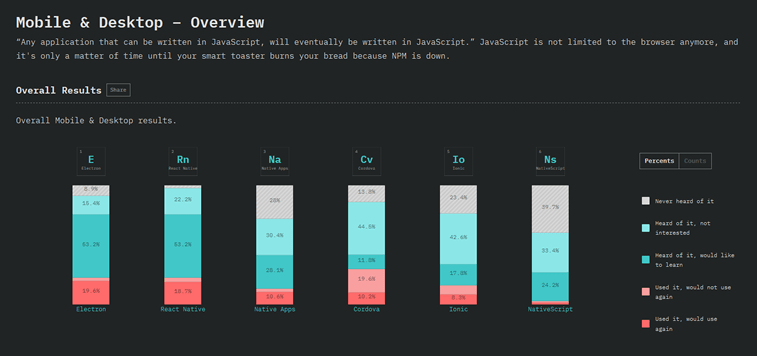
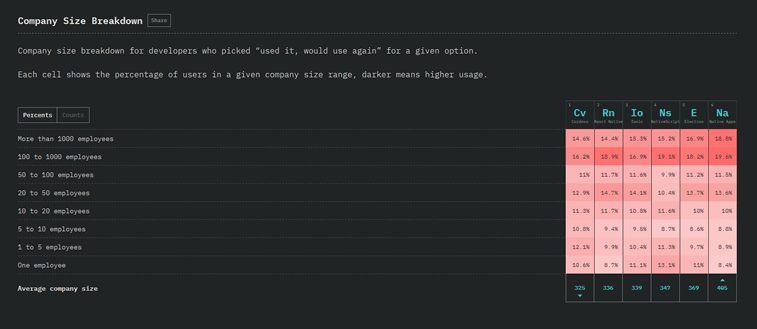
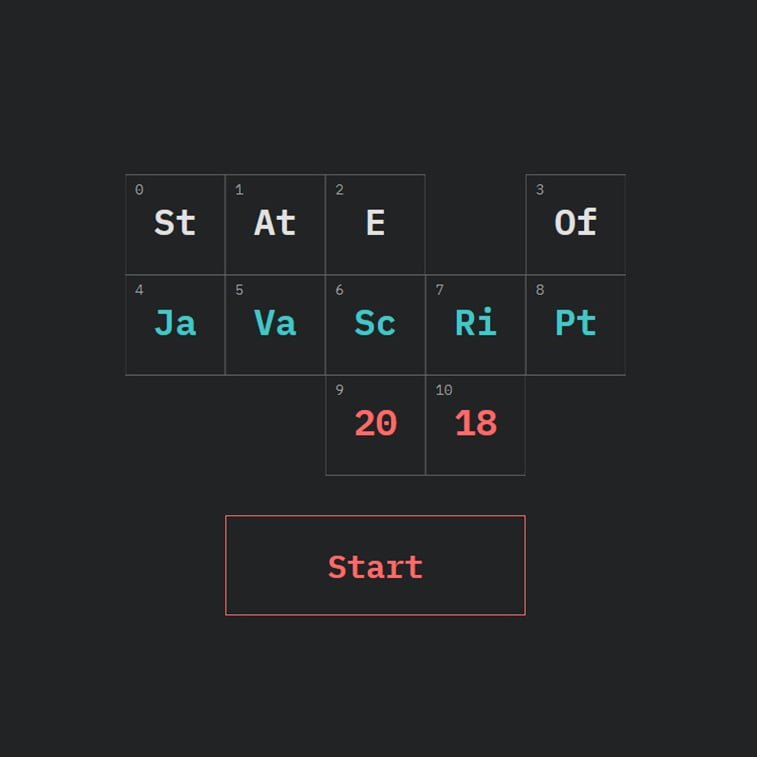
Now we present you some of the results through the following screenshots from the official website, and we surely encourage you to check it out for yourself (if you haven’t already) by diving deeper into the State of JavaScript 2018 and learning more about the newest JavaScript trends.
